Contact Modes
Static Mode (Contact Mode)
Static mode, or contact mode, is the original and simplest mode to operate an AFM. In this mode, the probe is in continuous contact with the sample while the probe raster scans the surface. In other words, the probe "drags" across the sample. The most common configuration of static mode is to operate it in constant force or deflection feedback mode. In this mode, the cantilever deflection is the feedback parameter. The cantilever deflection is set by the user and is related to how hard the tip pushes against the surface so that the user controls how gentle or aggressive the interaction between the probe and the sample is.
Static mode can also be operated in constant height mode where the probe maintains a fixed height above the sample. There is no force feedback in this mode. Constant height mode is typically used in atomic resolution AFM, though it is uncommon for other AFM applications.
Finally there is a configuration known as error mode. This mode is operated in constant force mode. However, the topography image is then further enhanced by the addition of the deflection signal to the surface structure. In this mode the deflection signal is also referred to as the error signal because the deflection is the feedback parameter; any features or morphology that appear in this channel are due to the "error" in the feedback loop, or rather due to the feedback loop needing to kick in to keep the deflection setpoint constant.
In static mode with constant force, the output consists of two images: height (z topography) and deflection or error signal. Static mode can be a useful, simple imaging mode, especially for robust samples in air that can handle the high loads and torsional forces exerted by static mode, but also, surprisingly, for more delicate samples in liquid, as long as the force can be controlled below 100 pN.
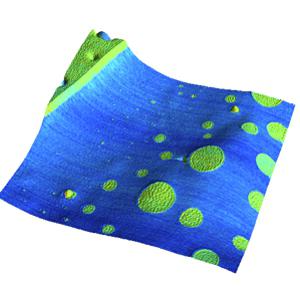
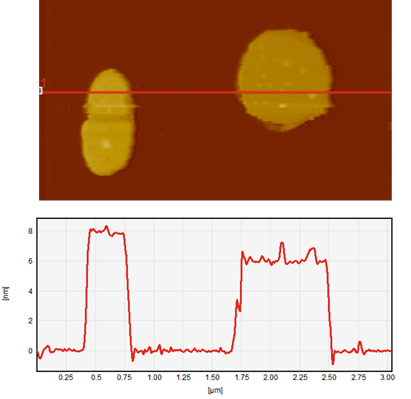
Imaging of membrane proteins like bacteriorhodopsin (BR) is an example for the latter. The topography image below shows contact mode imaging on membrane patches containing BR adsorbed on mica, recorded with a FlexAFM and a soft, 0.1 N/m probe. The overview shows two membrane patches facing the cantilever with different sides: left the extracellular side and right the cytoplasmic side. The difference in height is explained by different electrostatic interactions between membrane and mica and cantilever. In the right hand image there is a smaller scan area, in which individual trimers can be discerned in their native, crystalline matrix, with a distance of 6.2 nm between trimers.

Lateral Force Mode
Lateral force mode or frictional force mode is a form of static mode (contact mode). In lateral force mode, the imaging is exactly as it is in static mode except the cantilever scanning motion is generally performed perpendicular to the axis of the cantilever, as opposed to a freedom of scan rotation for conventional static mode. A schematic of the lateral force mode scan configuration is shown below.
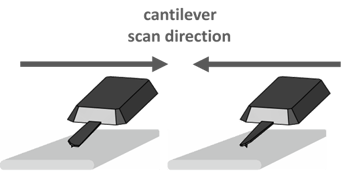
This mode is particularly effective for measuring the friction of a surface as the side to side twisting of the cantilever by torque, measured as the probe raster scans along the surface. Lateral force measurements can be converted to frictional force through calibration of the torsional spring constant of the cantilever.
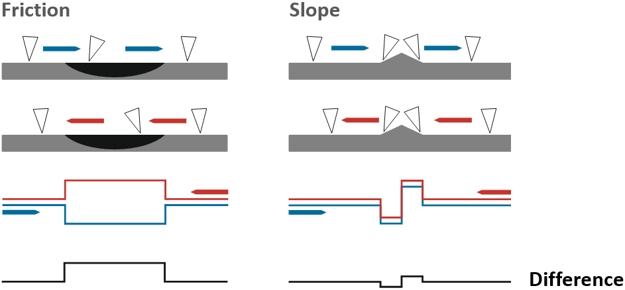
When operating in lateral force mode, it is important to be aware of topography that can convolute the lateral force signal. This is because changes in topography will incur a torsion onto the cantilever as well. In order to account for this topographic convolution, frequently lateral force images are collected both in the forward (retrace) and reverse (trace) scan direction and then subtracted from one another.
This concept is illustrated in the schematic below. The left image shows the effect of a feature in the surface (black semicircle) with friction contrast from the rest of the sample. The forward and reverse scan directions both show a change in friction over this feature; but the change is in opposite directions (blue trace and red trace). Subtracting the forward and reverse scans will enhance the difference in the frictional response. On the right hand side, the results of a topographic feature inducing a response in the lateral force (friction) response are shown. Now both forward and reverse traces show a signal in the lateral force channel in the same direction that is due to topography in this case, not actual frictional change. By taking the difference of the two images, the measured lateral force response is now reduced.
Lateral force images can be very effective at picking up material differences in the sample. Below are AFM images of a polymer blend of polystyrene and polybutadiene. The left shows topography where the two components in the blend are hard to discern. In the middle and the right are the two lateral force images in the forward and reverse direction where differentiation between the two components is easily observed.
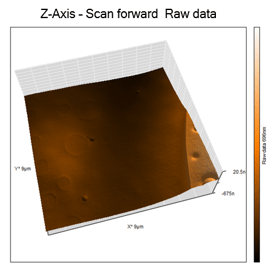

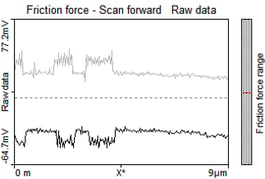
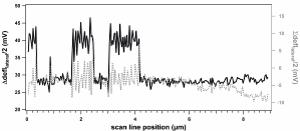
The friction is further illustrated in the profile line graph through the image (left graph below), in which the black profile belongs to the forward and the gray to the backward scan direction. Note to display data as "raw data" to correctly display the torsion working on the cantilever. Taking the difference, Δ/2, of the forward and backward movements results in the friction with less cross-talk from topography (black solid profile in right graph below). Taking the average, Σ/2, of the forward and backward lateral deflection gives a signal dominated by the height variations and almost without friction information (gray dotted line in right graph below).
The image below shows the friction calculated from the difference data overlayed on the 3D topography. It is rotated by about 180° compared to the above.