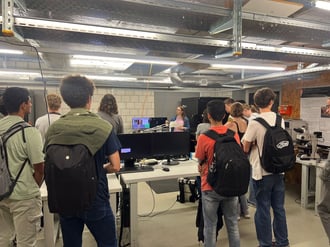
Students from Kirschgarten Gymnasium explore AFM technology at Nanosurf, gaining practical insights into nanotechnology ...
12.06.2024
19.01.2024

Héctor here, your AFM expert at Nanosurf calling out for people to share their Friday afternoon experiments. Today I play a bit with ringing microscopy to see what addition information about our samples it can offer.
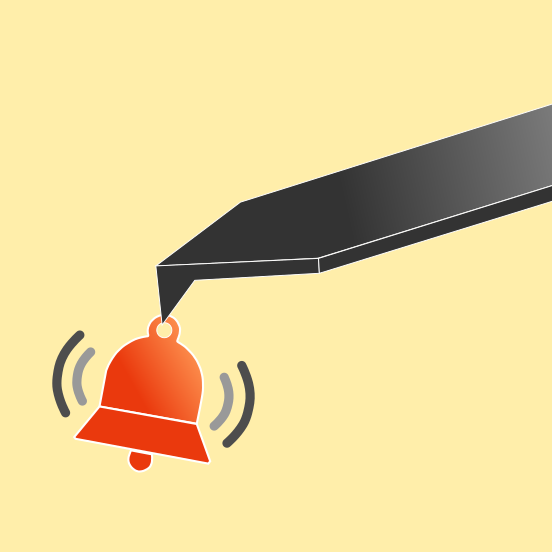
First of all, what is ringing microscopy? (See Ref 1) The basic idea is that the AFM probe, when pulled, and left on its own, rings at its natural frequency.
The rate at which the oscillation decays is dictated by the viscosity of medium (that is why when imaging in liquid they are greatly suppressed, why in air there is a fair amount, and why when imaging in vacuum they last almost forever). How this can be used to image surfaces?
The idea is that by looking at when the probe rings we are able to tell when it has been completely released from the surface. Hold on, I thought we could do that by looking at the adhesion? Yes and no. In some surfaces, when the probe detaches from the surface it is the end of the story, for other surfaces, directly on top there are molecules attached, or the existing molecules arrange in a particular order (e.g. the solvation layers in water at the interface with a solid (See Ref 2)). So, ringing microscopy lets us see that interaction more clearly than by just looking at the adhesion.
To understand this better, lets take a look at the force between the surface and the probe during one cycle of Wavemode imaging (check more about Wavemode here).
As you can see in the video, in Wavemode a laser is used to move the AFM probe cantilever up and down at off-resonance. On the top part the cantilever is off the surface, and the bottom part is applying a force against the sample. By comparing the maximum deflection when in contact with that when free, one can obtain the interaction force, and by setting a desired force, one can define a feedback loop to track the surface.
In the next figure I plot the force between probe and sample over time for simplicity.
At the beginning the probe is away from the surface (point 1), then, as laser light increases, the probe bends down approaching the surface. At some point, when the probe is closer enough, the van der Waals force snaps the probe down onto the surface (point 2) and we see a kink down in the curve. Then we are at the surface, and depending on how stiff is the probe and the sample, we simply push against the surface or we can even start indenting, this lasts until the maximum laser power is achieved (point 3). Point 3, the maximum force applied is then compared with the setpoint, and if the force is lower than the desired one, the Z piezo moves the probe closer, if the force is too large, the piezo moves the probe away (this is how the topography is tracked). After the maximum, the laser power starts decreasing and the applied force is being released, this happens until point 4, which is where the probe wants to go away but the surface is stick to it and wants to keep the probe in contact, this is the adhesion. After the adhesion, the probe is no longer in contact with the surface, but the molecules on top of the surface are now interacting with the probe and preventing it from moving completely free (point 5). Eventually, at point 6, the last molecule stops interacting with the probe and it is free to ring at its natural frequency. Ringing or more precisely damped ringing (i.e. point 7) is characterized by an exponential decay of the amplitude. So, what is ringing microscopy? Ringing microscopy is to measure the difference between point 4 and point 6 (which is approximated by fitting the ringing part of the curve). We can focus on either the energy difference (i.e. force times distance) between those two points or the position difference (i.e. deflection).
Ok Ok, all that technical part is nice and all, but how images look like? I know it has to do with molecules on the surface, but these tend to be quite homogeneous, so do we actually see something different than what we see by looking at the adhesion?
Well, the answer is tricky, because it requires a suitable sample on the first place, and I had to write the code to fit the curves and extract the data... (which I'm not going to show today because it is embebed onto a much larger piece of code and can be quite confusing) so I ended analyzing some old images and maybe the systems I chose don't highlight the full potential of this technique, but hopefully give us some background for the next time we have a suitable sample.
My first sample is the lettuce, which I showed when I introduced you to Wavemode nanomechanics (isn't it nice that we can go back and analyze the old data with something new?). This how the lettuce was first presented to you:
Then a month or so later I showed the nanomechanical maps of the stoma showing some interesting features in the stiffness channel. On the adhesion on the contrary, there wasn't too much a part from seeing that part of the surface was cleaned after scanning many times.
Now, I bring to you the disconnection energy or ringing microscopy part:
I know the difference between adhesion and dissipation is small, but that is the point, they are meant to be very similar unless there is really an accumulation of molecules for a weird reason. If you think about it, if the adhesion changes, the amount of molecules on top of that area should also change, which results on the dissipation image being almost identical to the adhesion... But in any case, they are almost identical but not quite. There are some marks that are present in one but not the other, probably indicating external contamination that felt onto the surface.
And I have another trick, I can substract one image from the other (scaled properly) to highlight differences. Physically has no meaning doing so, because one is force and the other energy, but we can allow it for comparison.
Now it is clear that there is new information in the dissipation channel, it points towards something that is likely contamination. Sorry, not huge reveal here, but as mentioned at the beginning, this was meant to be an exploration to see what this information channel could bring us.
Let's recap. The ringing of the AFM probe allows calculating the dissipation energy due to the interaction with molecules on top of the surface. The information this new channel carries is physically different to the adhesion channel, but visually similar, which makes it difficult to draw new conclusions by looking at the new data. However, through a careful examination and comparison of the different channels (topography, stiffness, adhesion, and dissipation), it is possible to identify what is pure dissipation due to molecules and what is adhesion from the surface. In the case of the lettuce, that highlighted what seems as contamination.
I hope you find this useful, entertaining, and try it yourselves. Please let me know if you use some of this, and as usual, if you have suggestions or requests, don't hesitate to contact me.
Further reading:
[1] Dokukin, M.E., Sokolov, I. Nanoscale compositional mapping of cells, tissues, and polymers with ringing mode of atomic force microscopy. Sci Rep 7, 11828 (2017). https://doi.org/10.1038/s41598-017-12032-z
[2] Garcia, R., Nanomechanical mapping of soft materials with the atomic force microscope: methods, theory and applications. Chem. Soc. Rev. 49, 0306-0012 (2020). http://dx.doi.org/10.1039/D0CS00318B
12.06.2024
Students from Kirschgarten Gymnasium explore AFM technology at Nanosurf, gaining practical insights into nanotechnology ...
29.11.2023
Discover how Nanosurf's collaboration with a team of scientists has revolutionized spring constant calibration for ...

16.10.2023
Discover how Dr. Nitya Nand Gosvami and his team at IIT Delhi harnessed the power of Nanosurf's FlexAFM and DriveAFM ...

02.07.2024
FridayAFM: learn how to automatize data analysis in MountainsSPIP

26.06.2024
FridayAFM: learn how AFM makes possible modern ball point pens.

Interested in learning more? If you have any questions, please reach out to us, and speak to an AFM expert.