Discover the capabilities of WaveMode AFM in characterizing bottlebrush polymers with unprecedented detail and speed, ...

21.03.2025

Héctor here, your AFM expert at Nanosurf calling out for people to share their Friday afternoon experiments. Do you know that you can bring your gaming skills onto the lab?
Today you will learn:
About 20000 hours. This is how much time I have spent operating AFMs (13 years by 250 work days per year, by six hours per day... considering that sometimes I worked overtime and some weekends and in many occasions running more than one AFM in parallel...). Do you know how much gaming time I have? My current estimation is more than 36000 hours. So, in terms of expertise I have to say that I'm a gamer first and an AFMer second. Can I somehow combine these two?
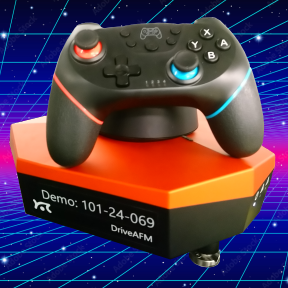
Can I make a gamepad-controlled AFM and thus combine both passions?
I know that Nanosurf's AFM's can be interfaced through Nanosurf Python interface.

Remember these examples:
FridayAFM - Arduino, Python, and MoS2
I also know that there are Python libraries dedicated to gaming. For instance, the Pygame library.

What else do I need?
Well.... ehem... the gamepad?
Oh yes, for that I choose a generic gamepad

and I tested it using the Hardware tester website: (this same page was also very useful during development to see button mappings).

But unfortunately, this is not all the story, there is challenge ahead.
Let me explain.
This is what I plan to do: get a gamepad, connect it to a Python script, use the script to interface Studio (Nanosurf's AFM control software), and then ultimately, operate the AFM this way.
Something like in this scheme below.

But the interface is not designed to operate this way.
The issue is that the interface between the controller and the computer is designed to send packets of data which are quite large, but not many packets per second, and if we want to read out the position of the AFM probe with Python, we need to be able to send and receive many "tell me position" and also many "this is the position".

To solve this, I decided to skip the controller-PC interface for the readout, and use an Arduino UNO instead. The idea is that while the interface will be slow for a stream of data, the User Analog Outputs are fast enough. I will lose resolution operating this way, but hopefully not that much (the math is something like this, 100 μm are encoded in -10 to +10 V with 24 bit resolution, but the Arduino input is only 0 to 5 V and only has 12 bit resolution, so even in the best case, which is assuming the User Output is scaled without losing resolution, we have 12 vs 24 bit, which means that the Arduino will not be able to see all the voltage steps the controller can see).
So the final setup looks something like this:
 You might notice that at the moment we are only monitoring X Y and Z positions and not amplitude or deflection, this is because at the moment we are only interested in topography, and the heavy-lifting task of tracking the surface is left to the AFM controller, so we don't need to do anything with those signals. Nevertheless, if one wants to track an additional signal, there is another user output and the Arduino has plenty of analog inputs.
By the way, the setup looks like this (it is prototyping, it could look worse, believe me):

Now for the tricky part, the Python script.
During my life I made a lot of scripts for the lab, but those where in Matlab or Labview, never on Python, so the learning curve here was a bit steep for me... and this might not be the most elegant solution, but this is what I came up with:

The script has a GUI (right hand-side of the picture above) where the user can choose the button mapping to assign specific functions to the buttons (e.g. to initiate a scan using the current parameters, i.e. set point, speed, imaging mode...), a plot to visualize the tip position (i.e. X, Y, and Z coordinates), and controls for the plot, to choose the range of the axis.
Inside of the script (left hand-side of the picture above), the GUI is one loop running on its own thread, it takes care of updating the button mapping, setting the plot properties, and running two other loops, one to update the plot with new data, and another to listen to the gamepad.
Then there is the AFM orders definition, which are there for when the gamepad requests them.
And finally, there is another thread, independent of the GUI, which reads the serial port (i.e. the Arduino), updates the data that the GUI uses for plotting, and also saves the data to the hard drive.
It took me some trial and error to come up with this architecture, and the main reason is that the library used to create the GUI is not very fast, it is designed for user interfaces, not for fast communications. Hence, I had to use an independent thread for listening to the Arduino.
Speaking of speed, the Arduino itself also has a few tricks. First of all, there is very little documentation of how fast the Serial communication can go. The recommended maximum is 152000 bps, but I tested up to 2M bps and it seems the error rate is low (or at least with my USB cable it was low).

The next trick is that the Arduino UNO has only two ADC, which means that if we try to read three voltages very fast, one of the will be repeated because there was not enough time for the ADC to change. This is why I had to alternate between writing to the Serial port and reading analog voltages.
More about the code. By now,m if you have checked some of the other Python examples, you will know the basic architecture:

Here are some other useful commands (don't worry, I include this cheat-sheet int he github repository).
These ones below for instance relate to reading/writing tip position. Notice the difference between the output value applied to the piezo that moves the tip and the realmovement read through the position sensor.

The next ones relate to the feedback parameters, changing geins, reading setpoint, or disabling/enabling the feedback.

Last but not least, very useful commands to initiate a scan and selecting things like scan range and number of pixels.

Now, if we look at the code I used for the gamepad controller you will recognice some of these commands.
For instance, this function will change the setpoint when the gamepad button asociated with it gets pressed. first it reads the current value, and then increases it by a 10%.

This other one for instance, will initiate an approach to the surface using current setpoint and feedback parameters.

The routine for start/stop scanning has more commands but it isn't more complex. It first checks if the system is currently scanning, and if it is, it stops it. If it is not scanning, then proceeds to change the scan generator type to spiral and sets the scan range and number of pixels, and initiates a scan.

I could continue with all the functions, but in general they are quite self explanatory, and it is better if you check the code and try to figure out what it does.
You can find both Python and Arduino scripts in here:
 and here:

So.... does it work?
Judge by yourselves
About data saving.
Data saving is a fundamental requirement, otherwise how can we study results? In this project it was a bit difficult because one of the things I wanted to do was being able to have non rectangular scans. To cope with this there are two things in the code I wrote, the first one is that we save the measured X, Y, and Z positions (not the output of the AFM, but the read position). This allows reconstructing the tip movement no matter what was the trajectory. It also implies that in order to visualize data one has to use tricks. The one I used in the GUI is that the data is fed onto an array using the "closest to a rectangular pixel grid". This works well in general, but it is not the only solution, for instance, there is something called Gaussian splatting, which basically replaces each data point for a blurred sphere, thus filling the empty spaces between data points.
The second one is that my data has a time stamp. This means that each saved data point has position and time when it was captured, and thus when visualizing the data we can see the tip movement and we can choose to see the entire range of time or restrict to the data captured at an specific moment in time. How this helps? Because then if the tip trajectory goes to a location where it was before, I can choose which data to visualize, the first one or the second, and thus my visualization and data saving can cope with overlapping scans. In fact, it can do more than that, we can capture force-distance curves within the same data file and still visualize the surface properly (we simply choose to display the latest Z point captured at the coordinate X, and Y).
I feel the topic will be too diverse if I include a lot more about this data format here, but feel free to ask me more, and for sure you will see more of it in future #fridayAFM posts.
Let's recap. With Nanosurf's Python interface the limit is the sky. My idea was to use a gamepad controller to move the AFM probe and trigger a number of actions. In the video for instance, pressing the buttons starts a force-distance spectroscopy at the current position and initializes a scan. The main advantage of doing this is the fine control over the scan area, potentially avoiding zones that can contaminate the tip or that are susceptible to be modified by the tip's influence. In addition, this way of controlling the AFM allows a fine control over where spectroscopy is captured. For instance, imagine trying to look for a virus capsule loosely attached. The ordinary way will be to scan until finding it, and then marking the position for a force spectroscopy, and then... if lucky and the visur didn't move, performing the spectroscopy. With the gamepad, one can visualize in real time if the probe goes on top of the virus, and can immediately trigger the spectroscopy, avoiding entirely the issue of the virus moving.
I hope you find this useful, entertaining, and try it yourselves. Please let me know if you use some of this, and as usual, if you have suggestions or requests, don't hesitate to contact me.
Bloopers:
The very first version of the script had no gamepad, no Arduino and no GUI, just a script requesting X, Y, and Z data from Studio software itself. Plotting the data on a Matplotlib plot was a triumph at the time.

Then I spent some time deciding if keeping a 2D visualization, or a 3D, or both. It is something I left out of the main video, but I included in the Teaser short video.
By the way, at the time I just discovered that the controller had implemented spiral scans, and the gamepad GUI was ideal to visualize them.
Later on, once I finally had a GUI, I thought it was fundamental to have a live visualization of what the gamepad was doing... lets say that it was complicated, and it didn't look nice. Plus, it was not future proof for other types of controllers. So eventually it came out.
Worth noticing: At some point I thought I had to build a hardware solution to condition the -10 to +10V coming out of the controller onto the 0 to 5V, and after some research, this is the simplest circuit I found.

Later on I discover that I can use Nanosurf's Python interface to scale and offset the user Outputs and there was no need for the hardware.
28.10.2025
Discover the capabilities of WaveMode AFM in characterizing bottlebrush polymers with unprecedented detail and speed, ...

27.10.2025
Read this blog and discover advanced alloy engineering and cutting-edge AFM techniques for high-resolution, ...

14.10.2025
Discover how WaveMode technology resolves the tobacco mosaic virus structure under physiological conditions with ...

08.12.2024
Learn how to make a Python code to interface your AFM with a gamepad.
01.10.2024
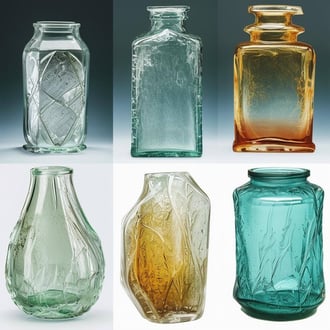
Discover how different types of glass age and degrade over time, and learn how to use AFM technology to investigate ...
11.07.2024
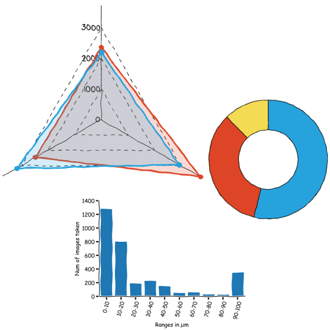
FridayAFM: learn how to perform datamining on large sets of AFM data.
Interested in learning more? If you have any questions, please reach out to us, and speak to an AFM expert.